> For the complete documentation index, see [llms.txt](https://help.hydravision.ai/llms.txt). Markdown versions of documentation pages are available by appending `.md` to page URLs; this page is available as [Markdown](https://help.hydravision.ai/products/asset-profiler/the-practical-step-range.md).
# The practical step range
The large cyan number at the top of your report. A range, not a single value. This is the answer the Profiler exists to give.
{% hint style="warning" %}
**The common misreading.** That the midpoint is a recommendation. It isn't. The range is the span of step sizes **this asset can support at all**. Where you sit inside it depends on the strategy you intend to run, and that's your call. The Profiler can't see it.
{% endhint %}
### What it means
Set your step too tight and the grid opens a crowd of positions inside moves that are far too big for that spacing. Set it too wide and PCL never gets the retrace it needs to close a pair, so you end up with grid cycles that never finish.
The practical step range is the window between those two problems, measured from the asset's own history rather than guessed at.
**The ceiling** comes from how much the asset moves. Above it, the retrace a close needs simply doesn't turn up often enough to be worth waiting for.
**The floor** is whichever of two limits is higher:
* **the movement floor** — below this, your step is inside the asset's own noise, and positions open on movement that means nothing; or
* **the cost floor** — the step below which spread and commission stop being worth paying for the profit that step earns.
Which one won is printed directly underneath, as **floor set by volatility** or **floor set by cost**. Glance at it every time. It's the single most informative word in the block.
### How to read
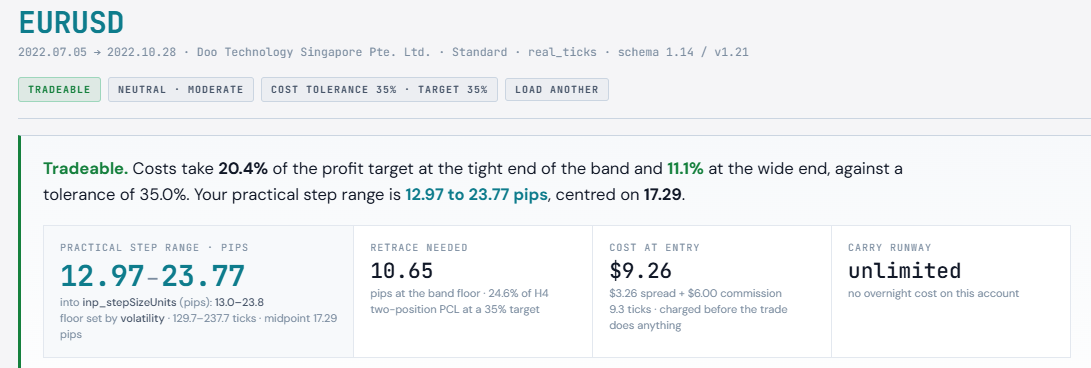
EURUSD from the sample set, 5 July to 28 October 2022:
```
Practical step range · pips
12.97 – 23.77
floor set by volatility · 129.7–237.7 ticks
```
Read that as: *anything from about 13 to 24 pips is defensible here. Below 13 you're trading noise. Above 24 the retrace stops showing up reliably.* The floor was set by volatility, which means costs took nothing away. The whole natural range is yours.
Now EURCAD, same broker, same window:
```
Practical step range · pips
18.86 – 24.10
floor set by cost · 188.6–241.0 ticks
```
The two pairs move almost identically: their four-hour ranges average 432 and 438 ticks. But EURCAD's floor says **cost**. Its spread is 14.9 ticks round trip against EURUSD's 3.3. Movement alone would have allowed a step as tight as 13.15 pips; the economics push the floor up to 18.86.
The tight end of the range, the part that fills most often, has been bought away by the spread.
{% hint style="info" %}
**Why a range rather than a number.** Wider steps cost proportionally less, because the same fixed entry cost is spread across a bigger target. Tighter steps fill more often. Nothing in the data picks between those for you, because the right answer depends on your strategy, your account and how many open grids you're comfortable with. What the Profiler can do — and does — is tell you where the two ends are.
{% endhint %}
### Turning it into a setting
The large number is in the asset's natural quote unit — **pips** for FX, **price** for metals and indices. The setting `Minimum Step Size` is not always in pips: Hydra Vision reads it in its own unit for each asset class, and on some symbols that unit is a different size from the quote unit.
So the report prints both. Directly under the range:
```
as Minimum Step Size: 13.0–23.8
floor set by volatility · 129.7–237.7 ticks · midpoint 17.29 pips
```
**The line that names the setting is the value in the setting's own unit.** The large number above it is the same range in the quote unit.
What one unit of `Minimum Step Size` means, by asset class:
| Asset class | One unit of `Minimum Step Size` is |
| ----------------------------------------------------------------- | ------------------------------------------------- |
| FX | 0.0001 in price (0.01 on JPY pairs), one pip |
| Gold | 0.01 in price, one cent |
| Other commodities (silver, oil, natural gas, platinum, palladium) | 0.01 in price |
| Indices (GER40, US30, NAS100, UK100 and similar) | 1.0, one whole index point |
| Crypto (BTC, ETH, XRP, LTC) | 1.0 in price, or 0.01 when the price is under 100 |
[Ticks, pips and price](/products/asset-profiler/ticks-pips-and-price.md) explains how Hydra Vision decides the class of a symbol.
{% hint style="danger" %}
**On gold, silver and other commodities, the two lines differ by a factor of a hundred.** On FX and on indices they match. They are both correct — they're just different units.
| Symbol | Large number (quote unit) | `Minimum Step Size` line |
| ------ | ------------------------- | ------------------------ |
| EURUSD | 12.97 – 23.77 pips | 13.0 – 23.8 |
| EURCAD | 18.86 – 24.10 pips | 18.9 – 24.1 |
| XAUUSD | 15.03 – 35.03 price | **1503 – 3503** |
| XAGUSD | 0.3677 – 0.8571 price | **36.8 – 85.7** |
| GER40 | 175.8 – 409.8 price | 176 – 410 |
| US30 | 350.2 – 816.4 price | 350 – 816 |
On gold, a setting of `15` instead of `1503` is a step a hundred times too tight, which is exactly the first failure mode. On GER40 and US30 the setting counts whole index points, so it matches the large number. [Ticks, pips and price](/products/asset-profiler/ticks-pips-and-price.md) explains why.
{% endhint %}
{% hint style="info" %}
**Reading an older profile?** Profiles made before Asset Profiler v1.23 don't record the setting unit. The portal works it out from the symbol name and marks the value *(estimated)*, or, where the name isn't enough, asks you to re-run the profile with v1.23. Before v1.23 the report converted every symbol with the FX pip rule, which made the value a hundred times too large on 2-digit indices such as GER40 and US30 (the sample above showed 17577 – 40978 and 35018 – 81638) and on Bitcoin; FX, gold, silver and oil were right. A currency pair your broker lists with a contract smaller than 100,000 was profiled as non-FX before v1.23, so its whole range was built on the wrong basis; such pairs need a new profile. See *Profiles made before v1.23* on [Ticks, pips and price](/products/asset-profiler/ticks-pips-and-price.md).
{% endhint %}
### If the range looks wrong
**It's very narrow.** Costs have squeezed it from below. Check **floor set by**. If it says `cost`, Band compression is the page you want. A squeezed range is still tradeable; you're just paying for the privilege, and the verdict usually reads Marginal.
**It's collapsed to a single value.** The cost floor has reached the movement ceiling. The verdict will read *Not viable at these costs*, and no setfile fixes it. The cost structure has to change.
**It doesn't match your experience of the asset.** It may not be meant to. The range describes your window on your broker. A profile over a quiet three months and one over a volatile three months give different ceilings, and both are correct. See [When to re-profile](/products/asset-profiler/when-to-re-profile.md).
**It looks far wider than you'd ever trade.** On indices it will. US30's range starts at 350 index points because that's what the asset's four-hour movement supports. That's the asset talking, not a mistake.
### What to do with this
* Every step **inside** the range is one the asset's history supports; where you sit within it is a strategy decision the Profiler can't see, and back testing is where that gets tested.
* **floor set by** tells you what shaped the range. `cost` means the compression page is the next one to read. `volatility` means costs aren't the constraint here.
* The **as Minimum Step Size** line is the range in the setting's own unit. On gold, silver and other commodities it is a hundred times the large number; on FX and indices it is the same.